Australian Business Economists luncheon
Rob Nicholl, CEO
Since the GFC the AOFM has implemented a series of new market developments – including yield curve extensions, an issuance lengthening bias, a buyback program and a regular pattern of new infill maturities. What have these achieved and where do they sit regarding AOFM’s tasks now?
Thank you again to the ABE for the opportunity to provide an AOFM perspective on the year ahead.
Hopefully it remains useful for the AOFM to be clearly understood regarding operational plans rather than being seen as unpredictable or opportunistic in behavior. In this regard, all sovereign debt managers would value being judged as transparent, credible and predictable. However, as is always the case I add the caveat that increasing transparency and predictability requires a trade-off in operational flexibility – so projecting sufficiency of the former while retaining enough of the latter requires far less science than judgment. This means we probably won’t get it right in everyone’s eyes, but I hope it is meaningfully close.
This year we will complete our largest bond issuance program – it will be around $106 billion in gross terms. Achieving these programs has required quite a shift over time in the way the Government interacts with financial markets. To put this in perspective, in the first year after the GFC issuance was less than a third of this. Furthermore, the yield curve is now at 30-years, having only been at around a third of that too. And the investor base is now much broader and more varied than it was 7 or 8 years ago. Each of these aspects in turn has importance for how the AOFM engages with the market and we are regularly reviewing our approach with the specific aim of usefully applying our experience.
Operational Context - Aims
Before looking at where this might lead, let me retrace some context that frames our considerations on a range of issues – but most particularly the nature of the issuance programs.
The AOFM has three overarching objectives:
- meet the Government’s financing task in any year and in doing so ensure it has available the funds required at any point in time;
- achieve the first objective in a manner that reduces attendant risks and is cost effective for the taxpayer; and
- exercise responsible stewardship over the AGS market in a manner that promotes resilience and efficiency.
We view risk as having three dimensions – one is the potential for volatility in interest rate outcomes (which could make it harder to frame future Budgets); another is refinancing risk, which to us is the risk of not being able to rollover short-term maturing debt; and funding risk, which reflects an ability to meet the term funding task in any year as required.
Cost effectiveness does not simply mean that we only issue at the lowest possible yield – to do that of course would have us issuing nothing but short bonds. Achieving cost effectiveness is also something that requires a lot of judgment but it essentially means: we rely heavily on tenders because they will result in competitive price outcomes; that we put considerable effort into understanding appropriate pricing around syndications; and when thinking of issuing long-dated bonds we recognize that investors usually require a premium for taking long duration risk.
Operational Context - Tools
Our key operational tools are: the mix between nominal and indexed bonds; the tenor of new issuance; the length of the yield curve; when and how we establish infill maturities; buybacks; transparency in how we operate; and the extent to which we engage with the investor community.
Each of these I would have raised to varying degrees in the past although in reality the choice of issuance between the nominal and indexed bond programs has not been a significant factor in our overall strategy setting. This is largely because the difference in size between the markets has effectively allowed us to focus on linker issuance and market development as a consideration in its own right. We have been quite open about treating development of this market as based on maintaining liquidity and meeting what we assess to be the underlying sustained demand in a relatively small market. This means that our decision processes can be quite different at times to considerations regarding the nominal market.
Although now a familiar story, incrementally extending the yield curve and a lengthening issuance bias are, nonetheless, important context for understanding what the AOFM has been seeking to achieve over the past 5 or 6 years.
Operational Context - What has been accomplished?
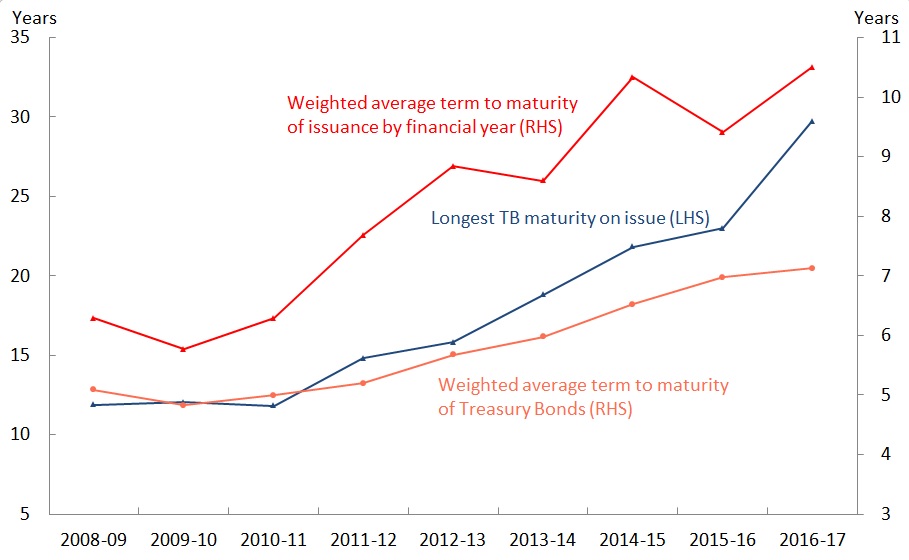
Chart 1: Curve extension, long issuance bias & extended WATM
This chart shows both of those as well as changes in the weighted average term to maturity of the portfolio (with yield curve length read from the LHS scale). Prior to the GFC, maintaining sufficient maturities at 2-year intervals was the driver to supporting the 3 and 10-year futures contracts. As the impact of the GFC on the budget (and in turn our issuance tasks) emerged, the first response for a large part of the increasing issuance was into short-end bonds – with this for a number of reasons being a forced rather than strategic choice. This was of course the opposite of what AOFM would pursue over the next 6 years.
Something to note from this chart is what looks to be small pull-backs in the lengthening bias in 2013-14 and last year. But they are in fact closer to trend than the outcomes for 2012-13, 2014-15 and this year – each of the latter which were heavily influenced by successful curve extension syndications.
Seen as weighted average-term-to-maturity, the portfolio will now take just over 7 years (on average) to turn over compared with around 5 years back in 2010-11, this acting to insulate it as a whole from future interest rate shocks. The lengthening issuance bias, together with a regular buyback program, will contribute to a further increase in the average-term-to-maturity and absent a sharp and substantial back-up in rates this will once again come at a much lower average yield than would have been available at any time in the past.
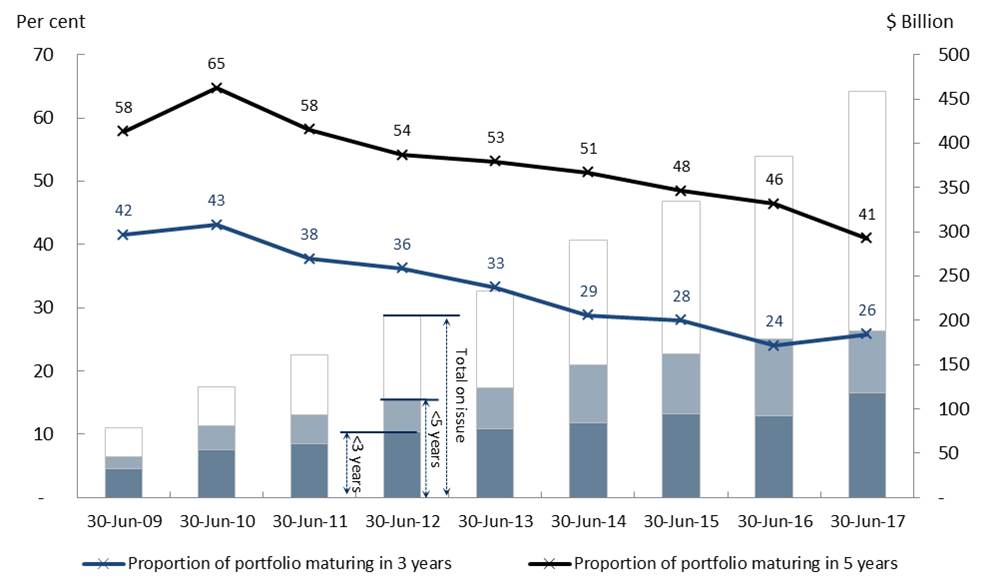
Chart 2: Proportion of TB portfolio maturing
Another way to view this risk is to consider the proportion of the portfolio that will mature in the near-to-short term. This chart shows a marked decline, 43% of the portfolio having being set to mature within 3 years in 2010, compared with only 26% now. The same trend is evident for maturities within the next 5 years – having declined from 65% at the end of 2010 to 41% now. This chart also illustrates the point I made about the lengthening bias, as 60% of the portfolio is now longer than 5 years (or beyond the 3-year futures contract). And even though the outright maturity volumes are markedly higher than in 2010, we feel comfortable about the forward call on investors in the context of a larger and more resilient AGS market.
A longer yield curve also offers more issuance options, which has boosted our operational flexibility while complementing increased diversity of the investor base.
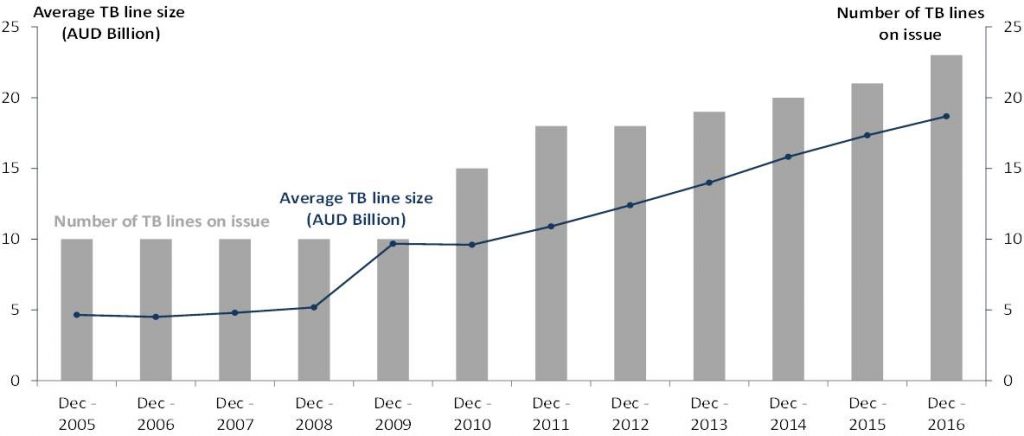
Chart 3: Number of bond lines and average size of lines
We now have many more nominal bond lines than at the GFC while the average size of the bond lines has more than doubled. That said, we have to some degree limited new maturities so that we can build deep and liquid lines – our assessment of the market based on the feedback that reasonable liquidity now emerges around the $10‑12 billion level for an individual nominal bond line.
It was only last fiscal year that we started establishing new second calendar year maturities around the 10‑year futures contract although they have been established at the 5‑year part of the curve for a lot longer. In 4 years’ time we will have two calendar year maturities out to the 10-year futures basket and this will help with increasing issuance options while at the same time managing the outright volumes of individual lines. The aim here is to balance the outlook for funding risk against maintaining strong liquidity for as many individual lines as possible.
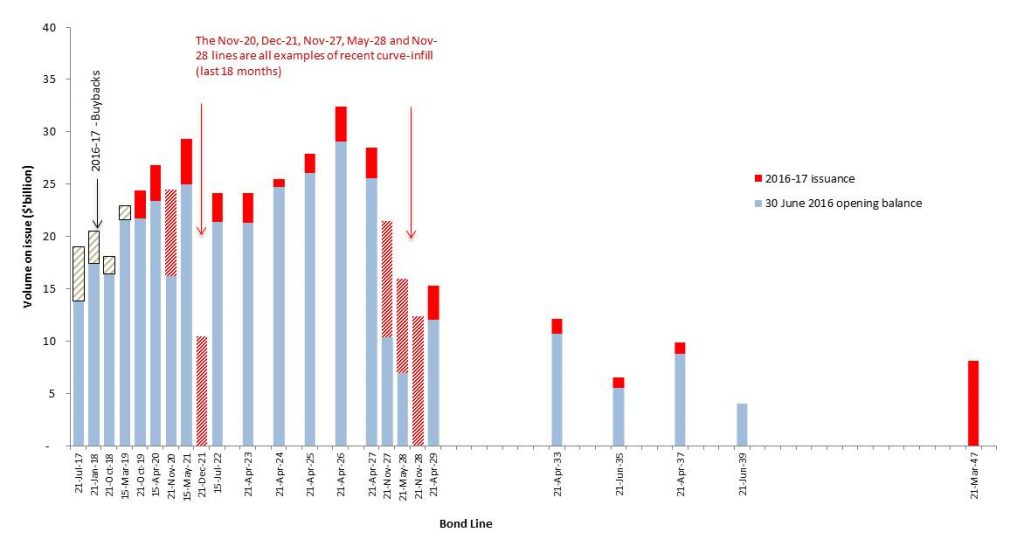
Chart 4: Managing funding risk through repeatable market operations
This chart brings together the operations I have mentioned in yet another way – highlighting the general growth in individual lines (with 10 Iines around or in excess of $25 billion), the role being played by the infill maturities (highlighted by the red hatched bars), and the impact to date of the recently introduced buyback program.
Operational Context - What Next?
We will continue to issue across the curve in order to meet demand from a broad investor base and are planning to increase the frequency of buyback tenders in the coming year. This will aim to increase the efficiency of the market by starting to remove stock about the time it rolls out of the 3‑year futures basket, while reducing the size of individual lines as they mature. However, in saying this I should point out that in order to fund these buybacks we need to issue equivalent volumes of longer dated bonds and so prevailing issuance conditions will to some extent act as a limiting factor on the size of each buyback tender.
This chart also highlights two other factors I want to address. One is support for the 20-year part of the curve, which remains a work-in-progress. I said last year when announcing the intention to launch a 30‑year bond that we were planning to establish bond lines at around 20 years and in doing so maintain a 2-year maturity gap, with a focus being to support the futures contract. I also said we would establish a 2041 maturity later this calendar year as a part of that plan.
We are now beginning to see more consistent demand in this part of the curve and in the last 6 months have been able to conduct a number of tenders both to meet that demand and to continue building the volume of stock on issue in this part of the curve. From that we hope to see a pick-up in liquidity which should, in turn, see further increased investor interest. That said, we continue to think that small syndications to tap existing lines will further this aim, and having announced this intention in October last year we are actively looking for appropriate opportunities to do just that. In terms of volume we expect these syndications to be in the order of $1‑2 billion.
In our view the existing maturities will benefit from this before establishing a 2041. This is why we have decided to delay introduction of a new line until next calendar year but remain conscious of the need not to delay it too long given our ongoing commitment to support the futures contract. And while I am not ruling out the 2047 as a candidate for a syndicated tap, we are more relaxed about how quickly this line builds – although that is definitely not to say we won’t respond to demand as it arises.
Some investors have asked us if we are planning to establish maturities at reasonable intervals out to 30 years and also if we plan to issue longer than 30 years. The answer to both of those questions for the foreseeable future is ‘no’. Overtime the 2047 and subsequent 30-year maturities will roll in to the region of the longest 20-year futures stock and this will replace the need to establish new maturities specifically to support the contract. Furthermore, we have had little if any indication so far that investor interest is appreciable for bond lines between the 20‑year futures contract and a 30‑year benchmark.
For the longest end of the yield curve we are definitely counting on sustained demand sufficient for us to establish a new 30‑year benchmark next year or the year after. That said, we see little scope for or benefit from extending the yield curve further. A number of countries have issued out to 50 and even 70 years and from my understanding these have been either one-off or yield related opportunistic deals. In addition, these have (mostly) been Euro denominated issues and therefore offer a currency advantage given the size and breadth of that market. Furthermore, there has been no indication to us that there would be any sustained investor appetite for such long duration in AGS. Therefore, any attempt on our part to do this would be unlikely to generate meaningful demand. A very small illiquid 50-year maturity wouldn’t add noticeably to extending the duration of our portfolio but would probably distract from the focus of our efforts to consolidate developments introduced in the last 6 years.
Let me summarize at this point by saying that we believe we have largely achieved our stated aims of providing for: a larger portfolio; the potential for continuing elevated issuance programs; increased issuance options; reduced funding and interest rate risk; and a sovereign market that is more easily comparable by offshore investors to other sovereign markets.
The follow-on from this is that investors can expect similar issuance behavior from us over the coming year to what they have seen over the last few years. That is to say, we will continue with the infill maturities to support the 3 and 10-year futures contracts; we will regularly issue into the demand that arises in those parts of the curve; we will continue with a long-end bias so as to continue to build-up stock in the ultra-long part of the curve (which will specifically include issuing to support the 20-year futures contract); we will continue to use syndications as appropriate given the effectiveness of them; we will increase the use of the buyback programs; and we will look to building the 2047 as demand emerges while monitoring the market for signs of support for a new benchmark maturity in order to maintain the yield curve at 30 years.
Operational Context - Outlook for Conditions
Turning to the conditions into which we expect to be issuing over the coming year, we note that there is a strong possibility of heightened geo-political instability. How this could impact economic growth trends internationally and in turn what that might mean for Australia are not matters we can anticipate with certainty. But getting ahead of our issuance task in the first half of the year will continue to mitigate the risk of an unforeseen material increase in the financing task during the year. Furthermore, we don’t anticipate a large shift in demand for Australian sovereign paper as a result of deteriorating global stability, but if this were to occur it would most likely result in a relatively more attractive AGS market, in turn supporting a consistent offshore bid.
One thing we are watching carefully (along with many of our offshore investors no doubt) is the compression of spreads between our paper and US Treasuries. Should the recent trend continue, or sharpen, this would create the potential for a period of market congestion – similar in effect but different in cause – from the periods of congestion we experienced last year. And I can assure you we noticed it. But with a planned issuance rate for 2017-18 appreciably lower than it was for the first half of this fiscal year I wouldn’t expect the same degree of angst compared to when our issuance rate was at or above $2 billion per week and the market felt ‘heavy’. The one area for qualification here relates to the buybacks because they are being funded by additional issuance. This means that there is at least some vulnerability from the fact that the buyers and sellers in this operation may be different parties. While at the volumes we are buying back this risk seems low it would, nonetheless, add another dimension of consideration during periods of market stress or congestion.
The AGS Investor Base
Let me turn for a moment to the changing proportion of foreign ownership because this is something that has been attracting increasing attention over the last year in particular.
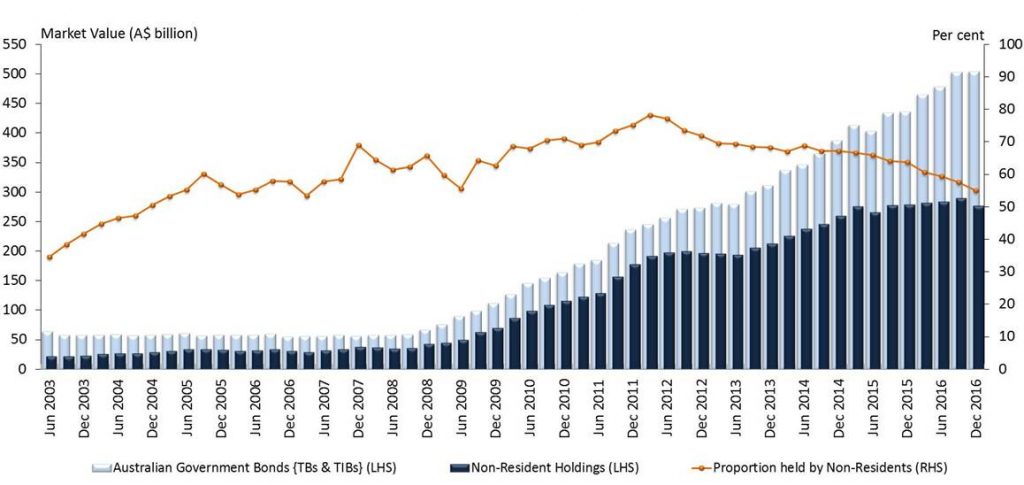
Chart 5 – Proportion of non-resident holdings of AGS
This chart shows offshore holdings and while presented in market value terms, it nonetheless provides a good indication. Clearly, the proportion of offshore ownership has been steadily declining - from a peak of around 80% towards the end of 2011‑12 to around 55% now (or about 60% if you remove the effect of offshore repo transactions). In view of this I think there are two relevant questions: first, what lies behind this change; and second, should we be concerned by this.
As to the first question I have in the past highlighted the difficulty in determining precisely what lies behind this trend - and in fact we believe it to be the result of a number of factors. One factor relates to the rate of offshore buying relative to the rate of increase in our issuance, the former having not kept pace with the latter.
Also, reserve manager accumulation of AGS is no longer a strong contributing influence on the market – firstly because there are very few reserve managers entering our market as new investors and those that have, in very recent years, are relatively small asset managers in global terms. Second, of the ones that did enter the market between 2010 and around 2014 most, if not all, will have finished building their portfolio allocations – which now makes reserve managers (as a group) far less relevant in terms of absorbing new issuance.
As to the second question - a declining significance of offshore investors is not in itself of particular concern. When the proportion of foreign ownership was much higher I would often get questions as to whether we saw this as a ‘bad’ or risky situation. Now that the proportion has been in steady decline I have noted commentary to suggest this should also be of concern on the basis that foreign investors are less attracted to Australia. Whatever your view I don’t think you can have it both ways and the AOFM has consistently been, and in fact remains neutral as to a judgment on this issue. We have maintained a view that it is a high concentration of investors of a particular type or from a particular region that represents a risk, and therefore diversity of the investor base is what matters more than whether it is skewed toward either domestic or foreign investors. In this regard we remain confident that there is sufficient diversity in the investor base and that we now have enough issuance options to satisfy varied investor demand. This gives us confidence that the AGS market will continue to operate efficiently.
As for ‘who’ has been the marginal buyer of our bonds during this declining proportion of foreign ownership, we do know that domestic banks have been significant buyers in recent years. Domestic banks now collectively hold about 20% of the AGS market, while holding just over 50% of semi-government paper. This has been at least partly to meet their liquid asset requirements, as the Committed Liquidity Facility made available to them to help meet these requirements has been reduced, largely as a result of the additional supply of AGS. But despite the notable increase in their holdings over the past few years, we see the volumes of AGS held by bank balance sheets as unlikely to create concerns about liquidity as a result of being held too tightly in too few hands. We are also confident that APRA and the RBA have an interest in monitoring this closely.
I have included these next few charts by way of trying to illustrate the diversity we do observe in the investor base because I think this adds to the relevant context of the issue. While there are literally hundreds of investors with whom we engage through our investor relations program, we have developed an internal (and informal) construct to help us understand who our key investors are and where we should be focusing our market engagement effort. This is because the breadth and scale of the task increasingly outweighs our limited ability to pursue it. The construct is what we refer to as a ‘major investor relationship’ and a ‘major investor’ is defined as an investor that, amongst other things, has a significant AGS holding; may have relatively low holdings but has indicated the potential to substantially increase their holdings; is a highly active AGS market participant; and/or is a regular and appreciable participant at our syndications. And for all the reasons you can appreciate this is not something that gets external expression by individual investor name.
We are looking at investor diversity from several perspectives.
Chart 6: Key investors – public vs private
| Year | Total Key Investors | Public | Private |
|---|---|---|---|
| 2015/16 | 123 | 48 | 75 |
| 2016/17 | 135 | 54 | 81 |
This table shows that the total number of ‘major investors’ increased by 10% from last year to this year, but that the split between them being grouped as either public or private institutions has remained constant at 40% - 60%.
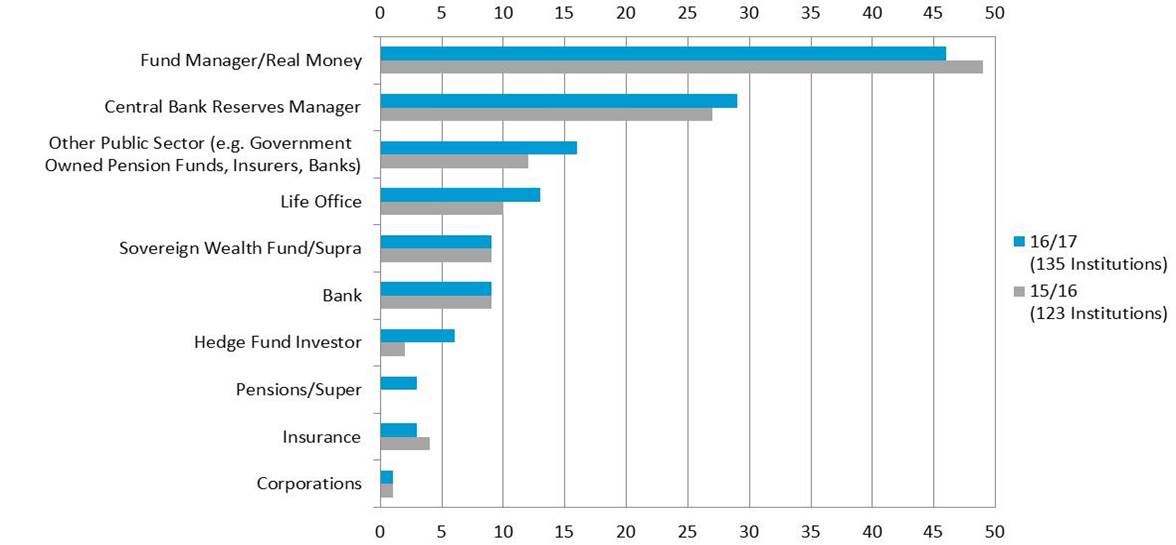
Chart 7: Key investors by investor type
This chart shows the breakdown by investor type according to how the AOFM sees the market. There are ten categories, seven of which we class as private sector and three we view as public sector: central banks; government owned pension funds and other institutions; and sovereign wealth funds. Although this chart doesn’t indicate the volume of holdings by each category, we can say with reasonable confidence that there is a correlation between the number of investors in each category and their relative importance as a group overall in the market. The changes for last year particularly worth noting are the increase in pension funds, insurers, and life offices – all I think reflecting a response by the market to the yield curve extensions – and in particular the 2047 syndication, which attracted a record 110 different investors of which 26 we had not seen participating in the AGS market before.
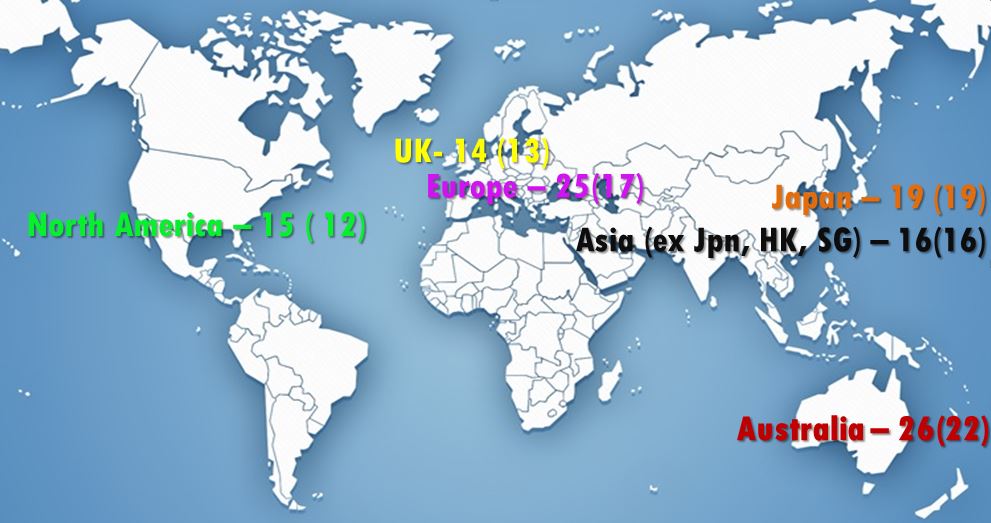
Chart 8: Key investors by geographic region
This last chart shows our ‘major investors’ by geographic region, although it doesn’t quite reflect the full geographic coverage of major AGS investors. This is because while showing 6 key regions from where the majority of AGS investors operate it doesn’t separately show the smaller number of ‘major investors’ for South America, India and the Middle East for example. It does, however, highlight the reason our market liaison efforts have a heavy focus on Asia (and in particular Tokyo) and Europe (including the UK and in particular London).
We think that this demonstrates a healthy diversity in the investor base, something we see little risk of retreating over the foreseeable future – absent the possibility of an appreciable tightening of spreads to US Treasuries – which would no doubt lead to a period of re-pricing in our market, but with the path and duration of that pricing change being very difficult to determine ahead of time.
RMBS
Turning to the AOFM’s RMBS divestment process, there is little more to report other than what is already in the public domain but for the fact that the book value of the portfolio has now dropped to below $2 billion - the first time since February 2009.
The Direction issued to the AOFM in May 2015 remains in place. It requires the AOFM to divest its RMBS holdings via a regular competitive process while minimising market disruptions. It also provides us with discretion not to sell RMBS when we think an acceptable price is unachievable. It is for these reasons that the divestment process remains suspended.
While I don’t wish to go into how we determine an acceptable price, I note that RMBS spreads have compressed, along with credit spreads more broadly, over the last year or so. So you can infer that we are closer to restarting on this basis than we were the last time I spoke to you. That said, we have noted that there has been a steady pipeline of primary activity in recent months and we interpret the Direction’s requirement to minimise market disruptions as being consistent with staying out of the way of primary market activity. At any rate, we have undertaken to give the market at least two weeks’ notice before recommencing the auctions.
Thank you.

